GIANT Tutorials
Tutorials for analyzing your genes in the context of predicted genome-wide tissue networks
# Tissue-specific functional relationships
Getting started: single tissue query
-
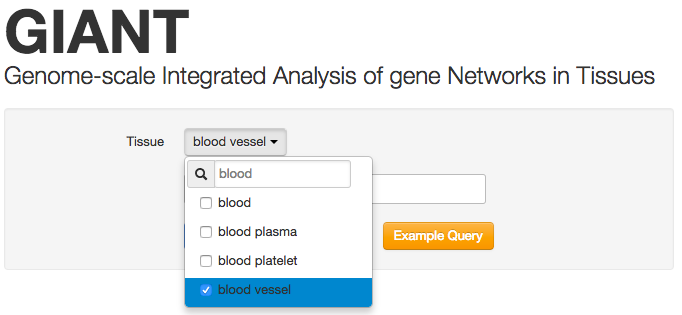
Select a tissue
To start using GIANT, first search for a tissue of interest and select it from the dropdown box. We suggest limiting an analysis to at most 4 tissue networks. Additional networks will degrade performance and hamper both usability and interpretability.
-
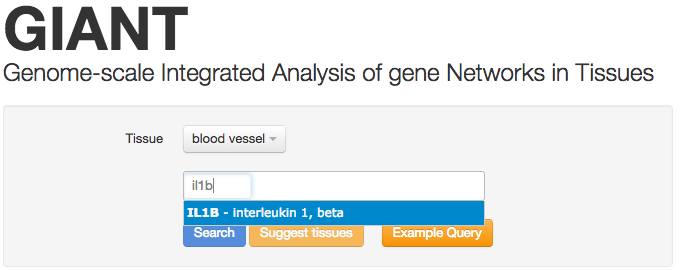
Enter genes
Next, enter one or more genes. We suggest limiting the number of genes to less than 10, as the visualizations and analyses are optimized for smaller gene sets. In this example, we're searching for the gene IL1B. The search box will automatically search for your gene as you type.
Predicted tissue-specific network
-

IL1B in the blood vessel network
IL1B in the predicted blood vessel is shown in the results page as a network visualization. The network displayed indicates the most functionally related genes to IL1B in the blood vessel network. Each edge value corresponds to the confidence of a functional relationship in blood vessel between the two connected genes. Slide the 'Minimum relationship confidence' and 'Maximum number of genes' slides to adjust how many genes (nodes) and functional relationship (edges) are show.
-
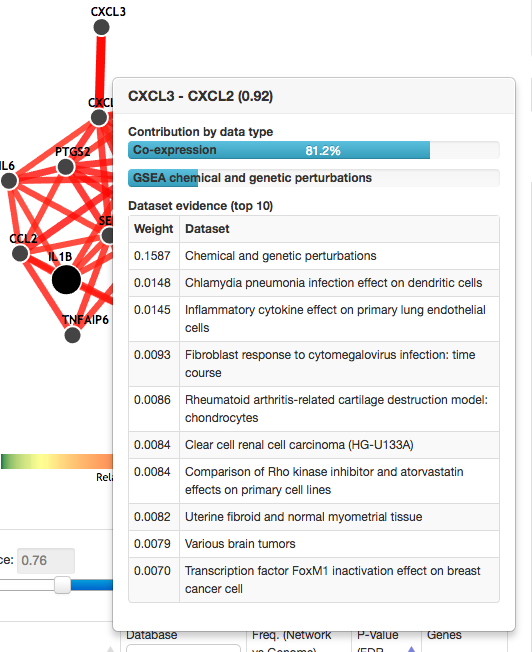
Relationship confidence and dataset contributions
The relationship confidence between CXCL3 and CXCL2 is close to 1 (.92), indicating a very confident prediction. At the top of the table, horizontal bars represent the proportional contribution of different types of datasets. In this example, the predicted relationship between CXCL3 and CXCL2 is mostly based on co-expression in microarray datasets (81.2%). The top individual datasets are also displayed, here showing what experiments were the most informative in predicting a functional relationship between the two genes.
Biological process, disease, and pathway
-
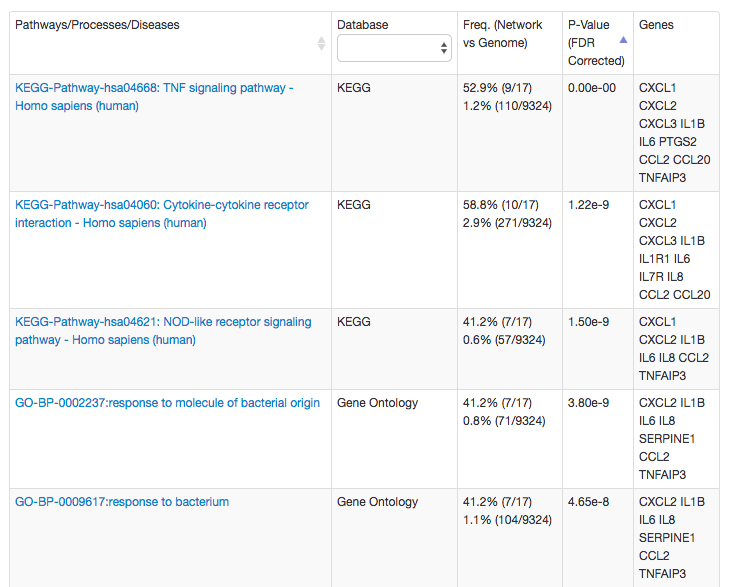
Enrichment of biolgical processes, diseases, and pathways in the blood vessel network
The enriched terms help to interpret the network of the query (IL1B) and related genes. In this case, the most enriched terms reflect the role of IL1B in the inflammatory response, and thus, its many related genes are also involed in the similar processes and pathways, suchs as TNF signaling and response to bacterium. Thus, the genes connected to IL1B in the blood vessel network but not annotated to these biologcal terms, are excellent candidates for additional experiments.
Example: IL1B response to inflammation in blood vessels
The above steps produced the predicted functional relationship and related genes of IL1B in the blood vessel. These genes serve as excellent canddiates for a role in mediating IL1B inflammatory response and additional experiments. For example, in Greene, CS, et al., we experimentally verified the tissue specific molecular response of blood vessel cells to stimulation by IL1B, a proinflammatory ctytokine.
We profiled the gene expression of human aortic smooth muscle cells (HASMCs; the predominant cell type in blood vessels) stimulated with IL-1β. Examination of the genes whose expression was significantly upregulated at 2 h after stimulation showed that 18 of the 20 IL1B network neighbors were among the top 500 most upregulated genes in the experiment (P = 2.07 × 10⁻²³). The blood vessel network was the most accurate tissue network in predicting this experimental outcome; none of the other tissue-specific networks or the tissue-naive network performed as well when evaluated by each network's ability to predict the result of IL-1β stimulation on the cells.
-

Predicted IL1B functional interaction partners from the blood vessel network are significantly upregulated after stimulation of blood vessel cells with IL-1β.
(a) The 20 genes most tightly connected to IL1B in the blood vessel network are shown. These genes are predicted to respond to IL-1β stimulation in blood vessel. (b) The bar plot shows the differential expression levels of the 20 IL1B neighbors measured in a microarray experiment at 0 h and 2 h after IL-1β stimulation in HASMCs, which constitute most of the blood vessel. Each bar represents the gene's log ratio of mean expression at 2 h over its mean expression at 0 h. Error bars represent regularized pooled standard errors estimated by LIMMA (n = 4 biological replicates). Eighteen of the 20 IL1B network neighbors (labeled in bold) were found to be among the most significantly differentially expressed genes at 2 h relative to 0 h (P = 1.95 × 10⁻²³).
#Translational example: studying the role of PARK7 in two tissue-specific networks
-

The functional roles of PARK7, known to be associated with Parkinson's disease, in two tissues.
The network displayed show the most functionally related genes to PARK7 in the brain and skeletal muscle tissue. Genes that are displayed in both networks are highlighted in blue and move in tandem to keep their positions in both networks coordinated. The 'Minimum relationship confidence' and 'Maximum number of genes' sliders can be adjusted independently for each network to change how many genes (nodes) and functional relationships (edges) are shown.
-
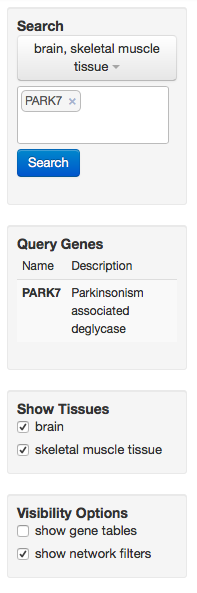
Several visualization controls for multi-tissue view.
As in single-tissue view, the current search can be modified to include a different combination of tissues and genes. The query genes are listed along with their short descriptions. Individual tissue networks can be toggled on and off to make it easier to compare tissues if many tissues have been queried at once. The gene set enrichment tables as well as related genes and relationships to query genes are displayed if the researcher checks the "show gene tables" checkbox.
Multi-network gene set enrichment
-
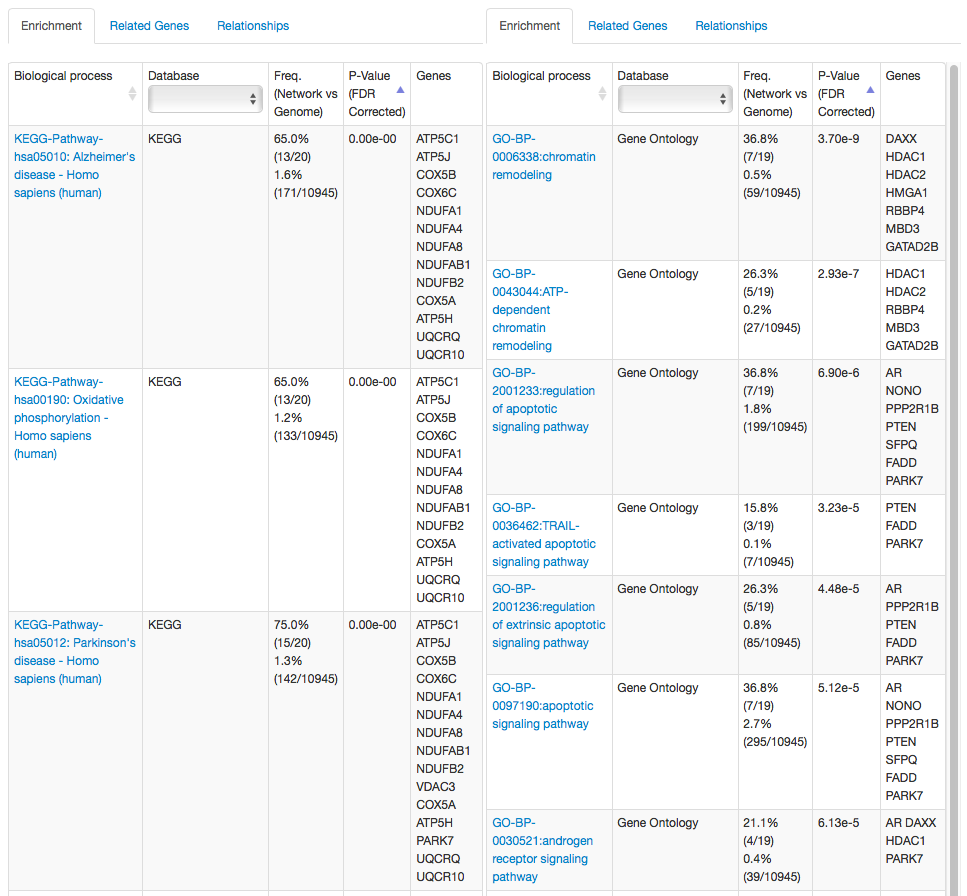
Gene set enrichment analysis of PARK7 neighbors in the brain and smooth muscle tissue networks
Even though the researcher has not specified the processes they are interested in, the tissue-specific networks reflect that PARK7 has different roles in different tissues by predicting functional relationships between PARK7 and many chromatin remodeling, apoptosis, and androden signaling genes in the smooth muscle network, and many Parkinson's and Alzheimer's disease genes in the brain network. If the researcher is specifically interested in Parkinson's disease, they may want to screen the other related genes in the brain network and use the related genes in the smooth muscle tissue as a control.
# NetWAS: Network-guided GWAS Analysis
NetWAS integrates tissue-specific networks and nominally significant p-values in genome-wide association studies to identify biogloically important disease-gene associations. The method has potential to discover novel candidate genes, and does not depend on known disease-associations, thus retaining the unbiased nature of GWAS.
-
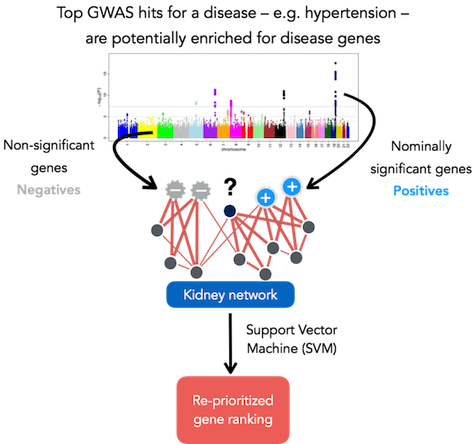
NetWAS method schematic
NetWAS trains a support-vector-machine (SVM), where the features of the SVM are interactions between genes in the selected tissue networks, positive labels are genes whose p-value fall below a selected cutoff, and negative labels are random genes above the cutoff. The SVM classifies — with five-fold cross-validation — all genes in the genome based on the tissue-specific interactions of the top GWAS genes (re-prioritized gene ranking). Note that no prior disease knowledge is used in this process - all disease signal is extracted from the GWAS study.
-
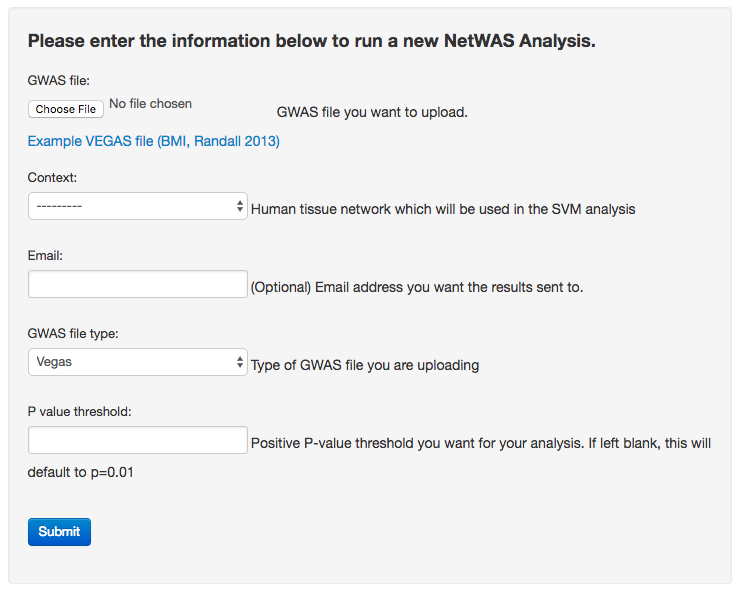
NetWAS input form
Users with a GWAS result (e.g. Example VEGAS file: bmi-2012.out) can upload their result file of gene association p-values using the GIANT web form. GIANT supports many file formats of commonly used tools that pool SNP associations to gene-wise p-values — a required step before running NetWAS. The user selects two options taking into account their particular GWAS result: 1) a p-value cutoff used to select “top” genes for training (the default is 0.01, which has been successfully applied in many NetWAS analyses) and 2) a tissue/cell-type relevant to the studied phenotype (adipose tissue). Upon submission, NetWAS is run on GIANT servers and does not require software installation or dedicated computational resources by the user.
Example: Analyzing a hypertension GWAS with the kidney network
-
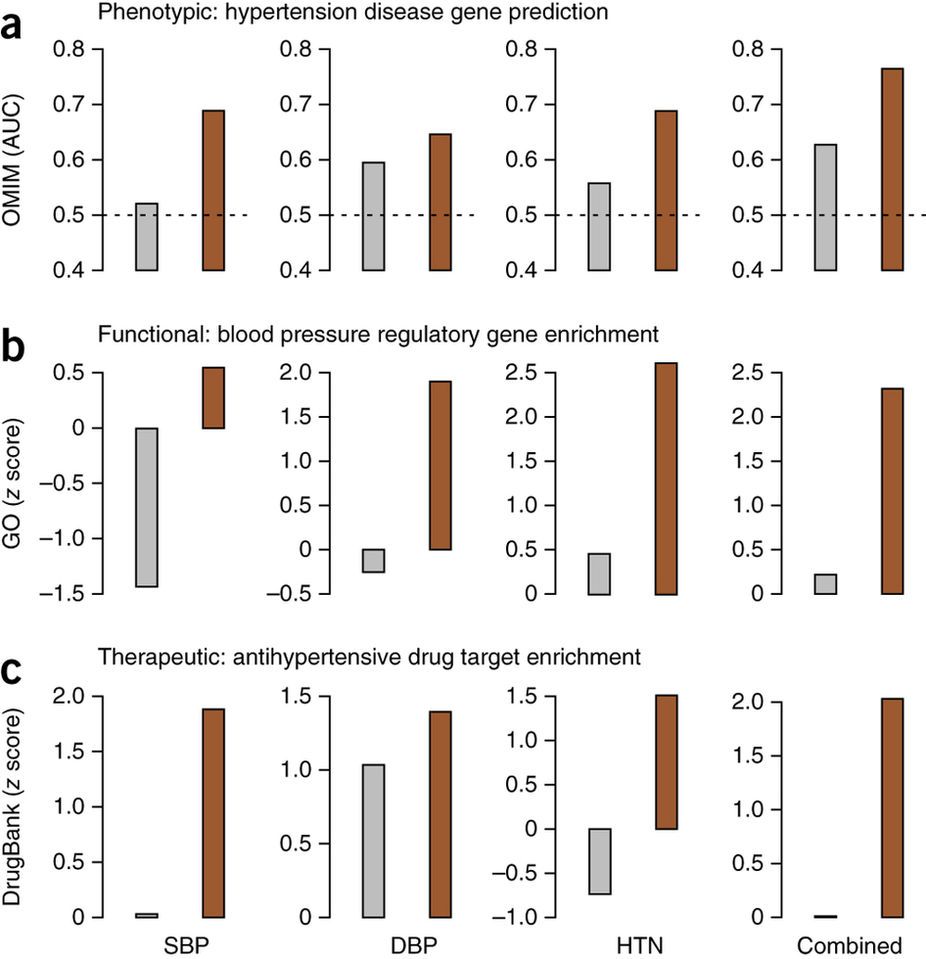
Network reprioritization of hypertension GWAS identifies hypertension-associated genes.
Genes ranked using GWAS (gray) and genes reprioritized using NetWAS (brown) were assessed for correspondence to genes known to be associated with hypertension phenotypes, regulatory processes and therapeutics. We compared individual (systolic blood pressure, SBP; diastolic blood pressure, DBP; hypertension, HTN) as well as combined hypertension endpoints. (a) Gene rankings were compared to OMIM-annotated hypertension genes using AUC. The AUC for the tissue-specific NetWAS is consistently higher than that for the original GWAS for all hypertension endpoints. Merging the network-based predictions for the three hypertension-related endpoints into a combined phenotype results in the best performance (AUC = 0.77; original GWAS AUC = 0.62; the dashed line at 0.5 denotes the AUC of a baseline random predictor). (b,c) Gene rankings were also assessed for enrichment of genes involved in the regulation of blood pressure (GO) (b) and targets of antihypertensive drugs (DrugBank) (c). The top NetWAS results were significantly enriched for genes involved in blood pressure regulation as well as for genes that are targets of antihypertensive drugs. Enrichment was calculated as a z score, with higher scores indicating a greater shift from the expected ranking toward the top of the list. In nearly all cases, the NetWAS ranking was both significantly enriched with the respective gene sets (z score > 1.645 ≈ P value < 0.05) and more enriched than in the original GWAS ranking.